Graphing Worksheets Through the Year + Sampler
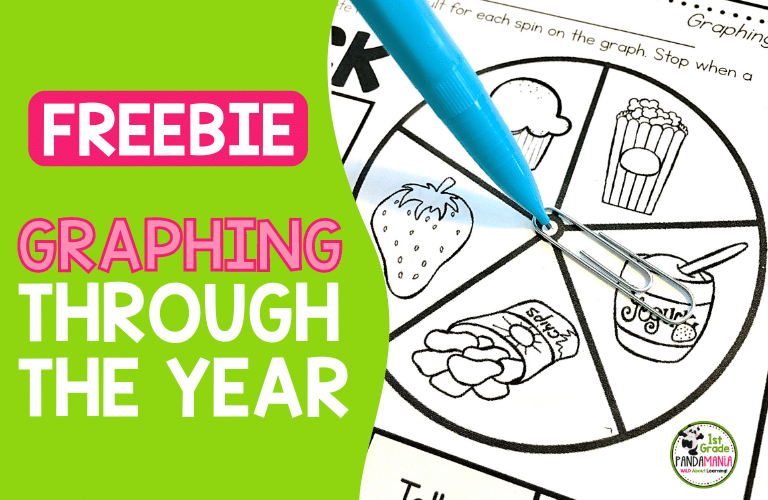
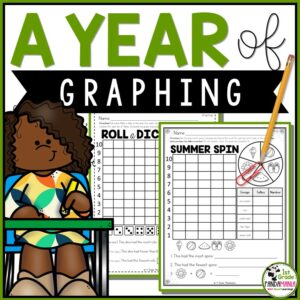
These graphing worksheets will take you through the whole school year and 1st and 2nd graders LOVE them. Find worksheets for every season to keep students engaged and learning about graphs. Students will first collect data, then record it on the graph, and then interpret their data with these Graphing Through The Year activities! Once you have them hooked, they won’t want to stop graphing!
Find modified graphing worksheet versions that are included for those who use the spellings: favourite and colour!
***Grab 4 FREE graphing worksheets at the end of this post***
As these math activities follow the seasons students will practice a variety of instructional math strategies which include:
- counting
- coloring
- rolling the die
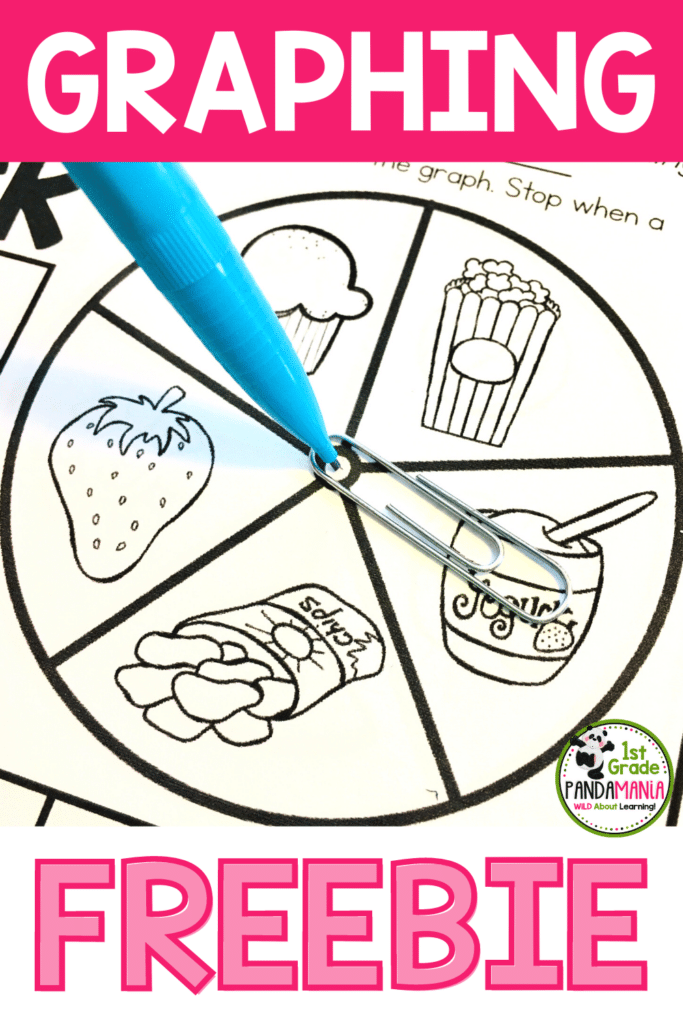
- spinning a pencil and paper clip
- recording data with tallies
- recording data and interpreting their data
- basic pictograph
- adding
- subtracting
- comparing
- and more!
The best way I like to use these graphing math activities is for math centers, small group instruction, and whole group math lessons.
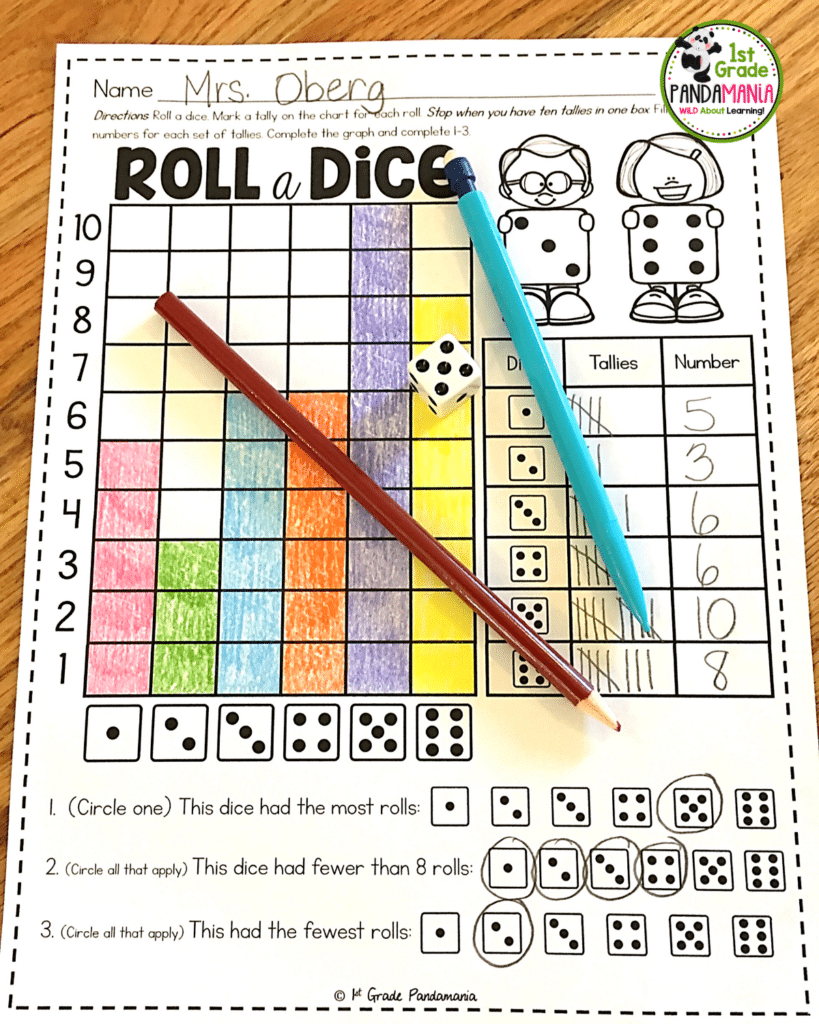
Easily print each graphing worksheet on heavy cardstock and slip them into plastic sleeves with the dice and paper clips to use repeatedly! With the dice and spin activities, data will be different each time.
See what other teachers like you are saying about these graphing worksheets:
“I used this as morning work starting with the 2nd or 3rd week of school; because of that, I was able to cut the graphing unit in half when we finally got there.”
~ ⭐️ ⭐️ ⭐️ ⭐️ ⭐️ Piedmont Academy (Tpt Seller)
“This was a perfect way to introduce and engage students in data representation and analysis. The types of questions that were graphed were accessible for all students and it was easily transferable to online learning when we have been put into snap lockdowns too.ing useful to the planet.”
~ ⭐️ ⭐️ ⭐️ ⭐️ ⭐️ Mrs Lindsay’s Learners
*Newly Added Packet*
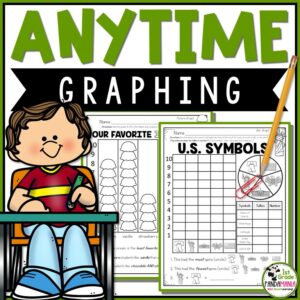
What’s new? We added our Anytime Graphing Bundle! Once we found out our graphing through the year activities packet was loved by so many teachers, we wanted to make more math activities that practiced different skills! Take a look at this new graphing activities bundle Anytime Graphing below.
As you can see, this pack is similar to the Graphing Through The Year Activities but has a greater variety of graphs, including:
- basic pictographs
- pie charts
- bar graphing
- tallies
- counting
- sorting
- adding
- subtracting
- comparing
- and a blank create your own
Check out some worksheet examples below:
Thanks for stopping by!
Looking to help build all kinds of math skills for your students? Check out these blogs:
- 6 Number Sense Math Activities + FREEBIES
- FREE Ten Frame Addition and Number Sense Activities
- SUBITIZING Activities for Strong Number Sense! + Freebie!
- Easily Practice Essential Math Skills Daily + FREEBIE
-
 Product on saleNumber Sense Flash Cards BUNDLEOriginal price was: $9.50.$8.00Current price is: $8.00.
 -
 Product on saleGraphing Activities BUNDLE | 1st Grade US and Canadian/UK VersionsOriginal price was: $7.90.$5.95Current price is: $5.95.

